
Home Values, Long Term Appreciation Lower in High Risk Zip Codes;
Underwater Rates, Share of Cash Sales Higher In High Risk Zip Codes
IRVINE, Calif. – Feb. 16, 2017 — ATTOM Data Solutions, curator of the nation’s largest fused property database, today released its third annual Environmental Hazards Housing Risk Index, which shows that 17.3 million single family homes and condos with a combined estimated market value of $4.9 trillion are in zip codes with high or very high risk for at least one of four environmental hazards: Superfunds, brownfields, polluters or poor air quality.
The 17.3 million single family homes and condos in high-risk zip codes represented 25 percent of the 68.1 million single family homes and condos in the 8,642 zip codes analyzed. A risk index for each of the four environmental hazards was calculated for each of the 8,642 zip codes, and the indexes were each divided into five categories of risk: Very Low, Low, Moderate, High and Very High. See full methodology below.
Of the 8,642 zip codes analyzed, 6,238 with 50.8 million single family homes and condos (75 percent) worth a combined $16.9 trillion did not have a High or Very High risk index for any of the four environmental hazards. For a detailed home sales data analysis, click here.
“Home values are higher and long-term home price appreciation is stronger in zip codes without a high risk for any of the four environmental hazards analyzed,” said Daren Blomquist, senior vice president at ATTOM Data Solutions. “Corresponding to that is a higher share of homes still seriously underwater in the zip codes with a high risk of at least one environmental hazard, indicating those areas have not regained as much of the home value lost during the downturn.
“Conversely, home price appreciation over the past five years was actually stronger in the higher-risk zip codes, which could reflect the strong influence of investors during this recent housing recovery,” Blomquist added. “Environmental hazards likely impact owner-occupants more directly than investors, making the latter more willing to purchase in higher-risk areas. The higher share of cash sales we’re seeing in high-risk zip codes for environmental hazards also suggests that this is the case.”
Breakdown of Natural Hazard Housing Risk by Zip
| High or Very High Natural Hazard Risk Indexes (out of 4 total) | ||||||
| 0 | 1 | 2 | 3 | 4 | Grand Total | |
| Zip Codes | 6,238 | 2,064 | 308 | 31 | 1 | 8,642 |
| Single Family Homes & Condos | 50,774,572 | 15,175,044 | 1,941,478 | 180,577 | 3,642 | 68,075,313 |
| Average Home Value | $343,259 | $292,619 | $231,654 | $181,650 | $198,263 | $326,590 |
| Average of 2016 Median Sales Prices | $295,595 | $252,680 | $199,819 | $159,248 | $170,000 | $281,428 |
| 1-Year Change in Home Prices | 7.0% | 7.2% | 6.1% | 5.9% | 17.6% | 7.0% |
| 5-Year Change in Home Prices | 41.9% | 44.1% | 39.6% | 57.6% | 130.8% | 42.4% |
| 10-Year Change in Home Prices | 3.6% | -1.5% | -3.0% | -5.4% | -43.9% | 2.1% |
| Avg Seller Gain Since Last Purchase | $69,448 | $56,660 | $37,677 | $30,424 | $57,500 | $65,120 |
| Avg of Home Seller Pct Gain | 24.9% | 23.1% | 17.5% | 20.8% | 51.1% | 24.2% |
| Avg Pct Seriously Underwater | 9.4% | 11.2% | 12.6% | 15.0% | 17.6% | 10.0% |
| Avg Foreclosure Rate | 0.60% | 0.55% | 0.68% | 0.67% | 0.31% | 0.59% |
| Avg Share of Cash Sales | 28.3% | 29.2% | 29.3% | 32.3% | 34.7% | 28.5% |
“State and federal regulations require some specific environmental disclosures, when the seller has knowledge, however many buyers take environmental hazards into consideration when making an offer on a home or when negotiating the post inspection agreement,” said Matthew L. Watercutter, senior regional vice president and broker of record for HER Realtors, covering the Dayton, Columbus and Cincinnati markets in Ohio. “The most common environmental hazards buyers inspect for are lead based paint, radon and mold. There are many other environmental issues buyers should consider, such as inspecting and testing for past meth labs in the property, the presence of asbestos and in rural areas and buried fuel tanks. Best practice as a buyer is to do your due diligence during the contract period, and know what you are buying.”
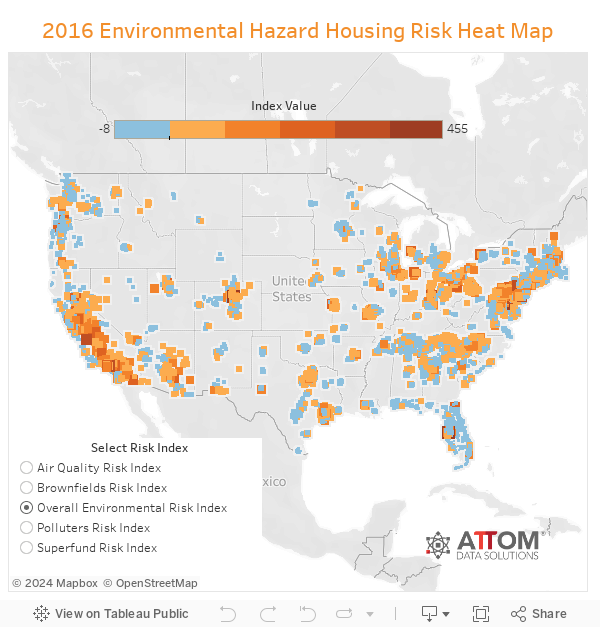
Top 10 zip codes for overall environmental hazard housing risk
A total environmental hazard index combining the four individual hazard indexes was also calculated for each of the 8,642 zip codes nationwide.
Zip codes with the 10 highest Total Environmental Hazard Index values were in Denver; San Bernardino, California; Curtis Bay, Maryland (in the Baltimore metro area); Santa Fe Springs, California (in the Los Angeles metro area); Fresno, California; Niagara Falls, New York; Saint Louis; Mira Loma, California (in the Riverside-San Bernardino metro area); Hamburg, Pennsylvania (in the Reading metro area); and Tampa, Florida.
| Zip Code | City | State | Overall Risk Index | 2016 Median Sales Prices | 5-Year HPA | Home Seller Pct Gain | Pct Seriously Underwater | Foreclosure Rate |
| 80216 | Denver | CO | 455 | $227,609 | 250.2% | 75.1% | 4.9% | 0.2% |
| 92408 | San Bernardino | CA | 400 | $197,500 | 105.7% | 36.2% | 13.3% | 0.6% |
| 21226 | Curtis Bay | MD | 380 | $153,822 | 2.5% | 3.4% | 14.4% | 0.7% |
| 90670 | Santa Fe Springs | CA | 356 | $435,000 | 52.6% | 36.4% | 3.4% | 0.5% |
| 93725 | Fresno | CA | 339 | $158,000 | 58.0% | 37.4% | 16.2% | 0.4% |
| 14303 | Niagara Falls | NY | 294 | $27,750 | -0.9% | 13.3% | 10.8% | 0.2% |
| 63133 | Saint Louis | MO | 291 | $17,000 | -2.9% | -55.0% | 45.4% | 0.2% |
| 91752 | Mira Loma | CA | 291 | $425,000 | 70.3% | 54.5% | 3.4% | 0.3% |
| 19526 | Hamburg | PA | 287 | $148,250 | 15.3% | 33.0% | 9.6% | 0.7% |
| 33619 | Tampa | FL | 285 | $88,000 | 104.7% | 23.9% | 27.5% | 1.4% |
Highest risk Superfund zip codes post weakest appreciation, highest foreclosure rates
The Superfund Risk Index for each zip code was based on the number of Superfund sites on the National Priorities List in 2016 as determined by the Environmental Protection Agency (EPA). See full methodology below. Similar to the overall risk index, the Superfund Risk Index was divided into five categories of risk, from Very Low to Very High.
Over the last 10 years median home prices have risen the most in Very Low risk zip codes, with the rise in prices lower in each subsequent category of higher risk. Median home prices in Very High risk zip codes are down 1.5 percent from 10 years ago.
Homeowners in Very Low risk zip codes have seen the biggest percentage gain in home value since purchase (24.4 percent) while homeowners in High risk zip codes have seen the smallest percentage gain in home value since purchase (19.6 percent).
Foreclosure rates are highest in Very High risk zip codes (1.0 percent), while foreclosure rates in Moderate zip codes are lowest (0.5 percent).
Highest-risk brownfield zip codes post highest underwater share, weakest appreciation
The Brownfield Risk Index for each zip code was based on the number of Brownfield sites in 2016 as defined by the EPA, and the index was divided into five categories of risk from Very Low to Very High. See full methodology below.
In zip codes in the Very High risk category, 17.2 percent of properties were seriously underwater, the highest of any risk category, with the share of underwater homes decreasing with each subsequent risk category lower. In zip codes in the Very Low risk category, 8.9 percent of properties were seriously underwater.
Over the last 10 years, median home prices have risen the most in Very Low risk zip codes (2.8 percent), while median home prices in Very High risk zip codes are still 2.8 percent below 10 years ago, the biggest decrease of any risk category.
Home sellers in 2016 in Very Low risk zip codes realized the biggest percentage gain in home price since purchase (25.3 percent), while homeowners in High risk zip codes realized the smallest gain (18.6 percent). Homeowners in Very High risk zip codes realized an average percent gain since purchase of 18.9 percent.
Lowest-risk polluter zip codes post biggest price gains, lowest underwater rates
The Polluters Risk Index for each zip code was based on the number of facilities included on the EPA’s Toxic Release Inventory (TRI) list in 2015 (the most recent data available at the time of the analysis), and the index was divided into five categories of risk from Very Low to Very High. See full methodology below.
Home sellers in 2016 in Very Low risk zip codes realized the biggest percentage gain in home price since purchase (27.7percent), with homeowners realizing lower percentage gains in each subsequent risk category higher. Homeowners in Very High risk zip codes realized a 16.6 percent average gain in home price since purchase.
In zip codes in the Very High risk category for polluters, 12.7 percent of properties were seriously underwater, the highest of any risk category, with the share of underwater homes decreasing with each subsequent risk category lower. In zip codes in the Very Low risk category, 9.2 percent of properties were seriously underwater.
Highest-risk air quality zips post weakest long-term appreciation, sales volume change
The Air Quality Risk Index for each zip code was based on the percentage of days in 2015 that were deemed to not have good air quality by the EPA, and the index was divided into five categories of risk from Very Low to Very High. See full methodology below.
There was only one zip code in the Very Low category, so not enough data to be statistically viable nationwide.
Median home prices in Low risk zip codes for air quality have risen the most over the past year and past 10 years of any risk categories, with lower price appreciation in each subsequent risk category higher for both one year and 10 years.
Home sales volume has increased 26 percent over the past five years in both Low and Moderate risk categories, while home sales volume has increased just 3.3 percent over the past five years in Very High risk zip codes and increased 16.5 percent in High risk zip codes.
Methodology
For the report, ATTOM Data Solutions analyzed 8,642 U.S. zip codes with sufficient housing trend data for the following four environmental hazards: poor air quality, superfund sites, polluters, brownfields and former drug labs.
A housing risk index was calculated for each of the four types of hazards in each of the 8,642 zip codes. The maximum index value for each index was 250 and the minimum value was 0.
A combined environmental hazard index comprised of these four factors and with a maximum possible score of 1,000 was assigned to each zip code. The highest actual score for any zip code was 455. Each individual natural hazard index accounted for 25 percent of the combined index.
Environmental Hazard Definitions and Sources
Poor Air Quality: This percentage is derived from the average percentage of days without significant traces of Carbon Monoxide, Fine Particles, Particulate Matter, Nitrogen Dioxide, Ozone, or Sulfur Dioxide in the air as reported by the Environmental Protection Agency. For more details, visit http://www.epa.gov/airquality/cleanair.html.
Superfunds on National Priorities List: is the list of national priorities among the known releases or threatened releases of hazardous substances, pollutants, or contaminants throughout the United States and its territories. The NPL is intended primarily to guide the EPA in determining which sites warrant further investigation. For more details, visit http://www.epa.gov/superfund/sites/npl/.
Brownfield Site: With certain legal exclusions and additions, the term “brownfield site” means real property, the expansion, redevelopment, or reuse of which may be complicated by the presence or potential presence of a hazardous substance, pollutant, or contaminant. For more details, visit http://epa.gov/brownfields/index.html.
Polluters: Data from the Toxic Release Inventory (TRI) Program that requires certain industrial facilities that manufacture or process more than 25,000 pounds of a TRI-listed chemical or otherwise uses more than 10,000 pounds of a listed chemical in a given year to report that to the Environmental Protection Agency. For more details, visit http://www2.epa.gov/toxics-release-inventory-tri-program.
About ATTOM Data Solutions
ATTOM Data Solutions is the curator of the ATTOM Data Warehouse, a multi-sourced national property database that blends property tax, deed, mortgage, foreclosure, environmental risk, natural hazard, health hazards, neighborhood characteristics and other property characteristic data for more than 150 million U.S. residential and commercial properties. The ATTOM Data Warehouse delivers actionable data to businesses, consumers, government agencies, universities, policymakers and the media in multiple ways, including bulk file licenses, APIs and customized reports.
ATTOM Data Solutions also powers consumer websites designed to promote real estate transparency: RealtyTrac.com is a property search and research portal for foreclosures and other off-market properties; Homefacts.com is a neighborhood research portal providing hyperlocal risks and amenities information; HomeDisclosure.com produces detailed property pre-diligence reports.
ATTOM Data and its associated brands are cited by thousands of media outlets each month, including frequent mentions on CBS Evening News, The Today Show, CNBC, CNN, FOX News, PBS NewsHour and in The New York Times, Wall Street Journal, Washington Post, and USA TODAY.
Media Contact:
Jennifer von Pohlmann
949.502.8300, ext. 139
jennifer.vonpohlmann@attomdata.com
Data Licensing and Custom Report Orders
Investors, businesses and government institutions can contact ATTOM Data Solutions to purchase the full dataset behind the Environmental Hazards Housing Risk Index, including data at the state, metro, county and zip code level. The data is also available via bulk license or in customized reports. For more information contact our Data Solutions Department at 800.462.5125 or datasales@attomdata.com.