


By Brady Irwin, Founder & CEO, Parcyl
Charlotte added 20,731 residents between 2024 and 2025, more than any other city in the country. You’d think that makes it the place to buy land. But among cities with at least 20,000 people, Charlotte was only the seventh fastest-growing city in its own metro area. The fastest was Fort Mill, South Carolina, about 20 miles from downtown Charlotte, which grew 6.8% and ranked 20th in the nation.
Both numbers come from the Census Bureau’s Vintage 2025 estimates. The first shows where the most people moved. The second shows where growth is fastest relative to what’s already there, and if you buy land for a living, that’s the one to watch.
Going into 2026, the thinking was that rates would come down and sales would pick back up. That didn’t happen. Freddie Mac had the 30-year fixed at 6.76% on September 10, up from 6.35% a year ago, and existing-home sales slipped to a 3.98 million annual pace in August, the first time they’ve been below 4 million since June 2025. When the overall market isn’t going up, you make your money by picking the right submarket.
Price shows up last
Price gets watched more closely than anything else in this business, but for deciding where to buy land it’s one of the least useful numbers out there. The reason is how long development takes.
NAHB asked land developers about that timeline in its June 2026 regulatory cost study. On average, it takes 15.1 months to get from a zoning application to the start of site work, and another 11.5 months before the finished lot sells to a builder. Then the house has to be built and sold before any of it reaches a median price.
So, when NAR put the national median existing-home price at $429,100 for August, the 38th straight month of year-over-year gains, a lot of what that number reflects goes back to decisions made around 2023. By the time the median price tells you a market has grown, most of the good buying there is done.
The same study found regulation adds $131,734 to the price of an average new single-family home, or 26.4% of the total, and 94.2% of developers said it delayed their projects by about seven months on average. Those numbers vary widely from one jurisdiction to the next, which is why they’re worth tracking.
What moves before price
A handful of public signals move well ahead of price. Few people use them systematically, because pulling them together across more than a few counties takes too long.
Building permits are the obvious one. In July’s new residential construction report, housing starts fell 12.4% to a 1.239 million annual pace while permits rose 5.0% to 1.443 million, with single-family permits up 2.5%. The regional split tells you even more. The South had 755,000 permits, the West 309,000, the Midwest 228,000, and the Northeast 151,000. That’s a good picture of where builders are committing money, well before it shows up in prices.
Entitlements are next. Two jurisdictions with similar demographics can end up with very different pipelines, and the difference usually comes down to how each one handles approvals rather than how much demand there is. What a city or county has approved, and how fast it moves, is public record. In my experience, it almost never makes it into anyone’s screening process.
Then there’s sewer and water capacity, which can stop development cold and barely registers in national data. Queen Anne’s County, Maryland, paused larger residential projects last year because of sewer limits, and this spring county officials concluded there was no practical way to significantly expand treatment capacity, so the focus shifted to managing what it already has. Anne Arundel County lifted its own moratorium in June after arranging to borrow unused treatment capacity from BWI Airport. Both decisions changed what could be built, and neither one shows up in a price index.
Last is ownership and transaction data. Deed and mortgage records show you an assemblage before it becomes a project. Long-term and absentee owners, one entity buying up neighboring parcels, tax delinquencies, and pre-foreclosures all tell you something is coming. In any submarket that ends up appreciating, somebody got there early, and the public record usually shows who.
The real bottleneck is search
Knowing what to look for is the easier part. Most acquisition teams still work one property at a time. You find a site, analyze it, do the diligence, and make a call. That’s fine once you know which market you want to be in, but it won’t tell you which market that should be. When a single parcel takes days to evaluate, teams stick to the three or four submarkets they already know, and the portfolio ends up concentrated in places that looked good a few years ago.
That kind of concentration is riskier than usual right now. The South has had most of the nation’s fastest-growing counties every year since 2020, but the same Census data shows Miami-Dade going from a gain to a loss between 2024 and 2025, and Pinellas County losing even more residents than it did the year before. Being in a growing region doesn’t guarantee much at the county level.
The better approach is to flip the process and start with your strategy. You set your criteria once (geography, asset type, parcel size, ownership, distress) and run the whole market against them continuously, with first-pass diligence on every match. Instead of vetting parcels one by one, you sort through everything that fits and decide what deserves a closer look.
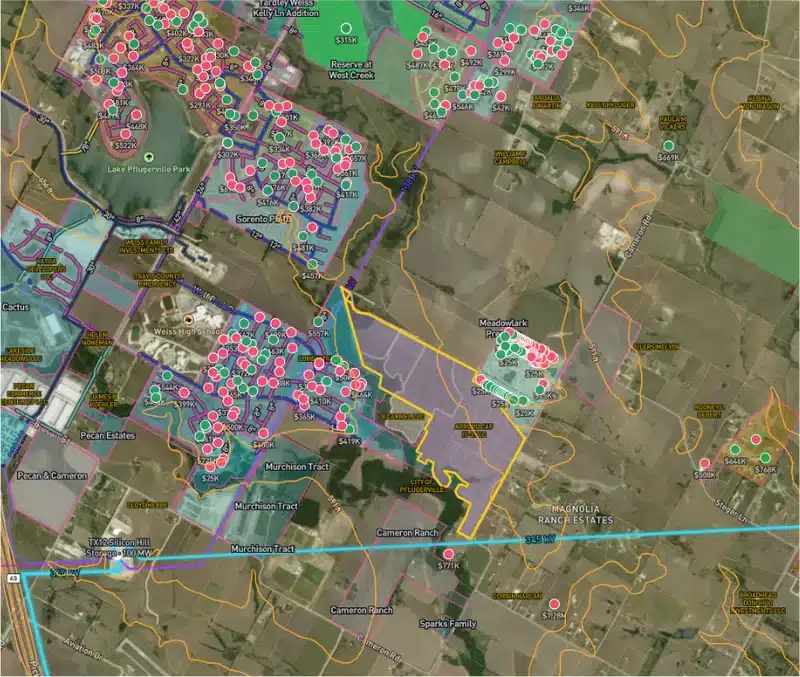
That’s how you find a growth market before it shows up in prices. Land is one of the few major asset classes that still doesn’t have a real index. Stock investors have screeners and bond traders have terminals, while most land buyers are still working from spreadsheets, county GIS portals, and what they know locally.
Where Parcyl fits
That gap is why we built Parcyl. It pulls property records, geospatial layers, and market data into one system, with ATTOM providing the nationwide property, ownership, tax, and transaction data underneath. Search and first-pass diligence keep running in the background instead of starting over with every parcel.
I’ll add a warning from our own experience building it. None of this works on inconsistent data. A lot of property data looks fine until you use it across different markets and asset types. Then formats change, records go stale, and important fields come back half empty. A model will still give you an answer, but it won’t be one you’d put capital behind.
Why it matters more now
When prices were climbing fast, appreciation covered for a lot of sloppy site selection. That isn’t the case anymore. NAR’s affordability index improved to 104.7 in August from 101.2 a year earlier, and sales still fell.
If you’re waiting for rates to drop before you start buying again, think about what that moment will look like. Every competitor will be looking at the same markets at the same time, and the growth markets will already be priced in. The lots that close two years from now will be in submarkets nobody has on a list yet. They’re filing entitlement applications now, and the sewer capacity to serve them is being allocated now. All of it is in the public record for anyone willing to do the work of reading it.
That’s my take.