According to ATTOM Data Solutions’ newly released February 2021 U.S. Foreclosure Market Report, there were a total of 11,281 U.S. properties with foreclosure filings — default notices, scheduled auctions or bank repossessions — reported in February 2021. That figure was up 16 percent from January 2021, but down 77 percent from February 2020.
ATTOM’s latest foreclosure market analysis noted that lenders started the foreclosure process on 5,999 U.S. properties in February 2021 – a 15 percent increase from January 2021, but still down 78 percent from February 2020. The report showed that among states with at least 100 foreclosure starts in February 2021, those that saw the greatest monthly increases in foreclosure starts included: Utah (up 230 percent); North Carolina (up 73 percent); Michigan (up 60 percent); Georgia (up 58 percent); and Mississippi (up 54 percent).
The February 2021 report noted that in looking at the data on a more granular level, among U.S. counties, those with the greatest number of foreclosure starts in February 2021 included: Los Angeles County, CA (234 foreclosure starts); Utah County, UT (224 foreclosure starts); Cook County, IL (154 foreclosure starts); Harris County, TX (97 foreclosure starts); and Riverside County, CA (74 foreclosure starts).
Also according to the report, nationwide one in every 12,182 housing units had a foreclosure filing in February 2021. The states with the highest foreclosure rates were Utah (one in every 3,883 housing units with a foreclosure filing); Delaware (one in every 5,219 housing units); Florida (one in every 6,232 housing units); Illinois (one in every 6,336 housing units); and Louisiana (one in every 7,923 housing units).
ATTOM’s new analysis noted that among the 220 metro areas with a population of at least 200,000, those with the highest foreclosure rates in February 2021 were Provo, UT (one in every 787 housing units with a foreclosure filing); Shreveport, LA (one in every 1,951 housing units); Lake Havasu, AZ (one in every 2,247 housing units); Cleveland, OH (one in every 3,943 housing units); and Florence, SC (one in every 3,980 housing units).
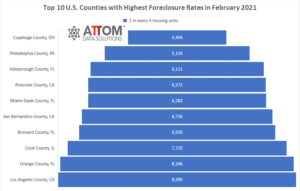
In this post, we take a deep dive into the data behind our February 2021 foreclosure market report to reveal the top 10 most populated U.S. counties with the highest foreclosure rates in February 2021. Among those counties with 1 million or more people, those with the highest foreclosure rates included: Cuyahoga County, OH (one in every 3,494 housing units with a foreclosure filing); Philadelphia County, PA (one in every 5,119 housing units); Hillsborough County, FL (one in every 6,111 housing units); Riverside County, CA (one in every 6,272 housing units); Miami-Dade County, FL (one in every 6,283 housing units); San Bernardino County, CA (one in every 6,736 housing units); Broward County, FL (one in every 6,920 housing units); Cook County, IL (one in every 7,723 housing units); Orange County, FL (one in every 8,246 housing units); and Los Angeles County, CA (one in every 8,395 housing units).
ATTOM’s February 2021 foreclosure market analysis also reported that lenders repossessed 1,545 U.S. properties through completed foreclosures (REOs) in February 2021. That figure was up 8 percent from January 2021, but still down 85 percent from February 2020.
The report also noted that counter to that national trend, those states that saw a decline in completed foreclosures from January 2021, included: Indiana (down 75 percent); Colorado (down 75 percent); South Dakota (down 67 percent); Utah (down 67 percent); and Alabama (down 56 percent).
Want to learn more about how foreclosures are trending in your area? Contact us to find out how!


