Just in time for Valentine’s Day, ATTOM Data Solutions looked at singles who are homeowners and which gender has the greatest home value.
IRVINE, Calif. — Feb. 14, 2019 — ATTOM Data Solutions, curator of the nation’s premier property database, today released an infographic behind an analysis where we uncovered top metro areas across the nation that saw the greatest difference in home value between single men and single women.
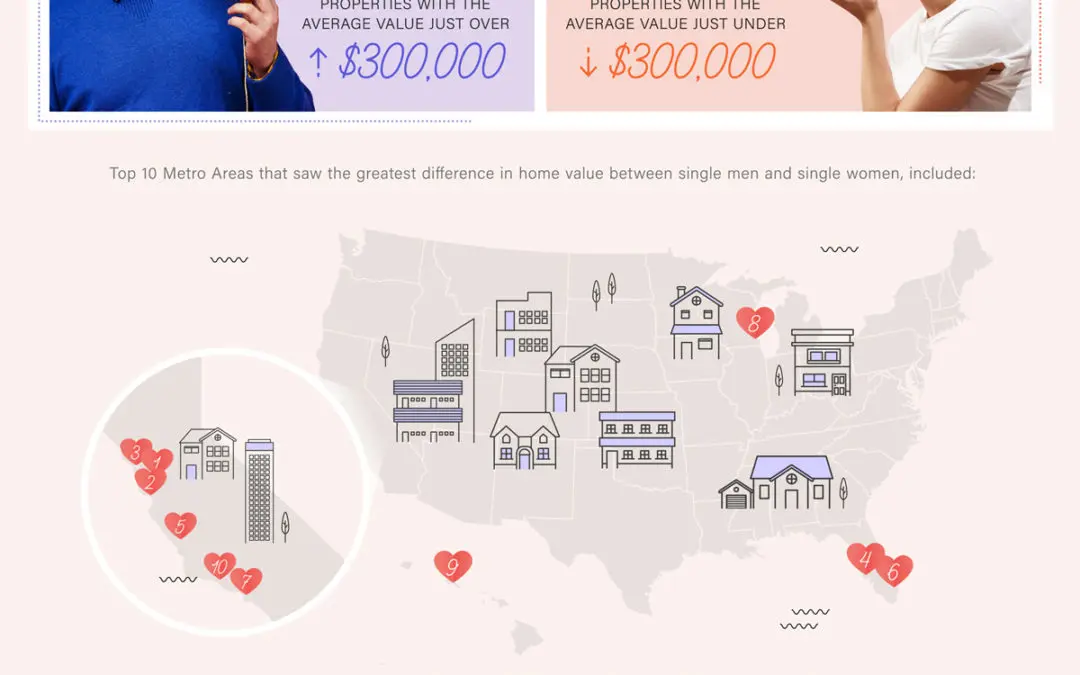
The analysis shows that on average single men owned over 1 million properties with the average value just over $300,000, and single women owned just under 1 million properties with the average value just under $300,000.
“According to the US Census Bureau, women earn 80.5 cents for every dollar a man earns, which in turn gives them less purchasing power when it comes to buying a home,” said Jennifer von Pohlmann, director of PR for ATTOM Data Solutions. “Therefore, it’s not surprising to see almost a $30,000 home value gap between single men and single women homeowners; however, we do see that in some of those higher valued markets, single women are owning more homes than single men, so hopefully it’s just a matter of time before the gender of the housing market values balance out.”
Six of the top ten metro areas where single men have the greatest gap in estimated home value compared to single women were in California: San Jose-Sunnyvale-Santa Clara; Santa Cruz-Watsonville; San Francisco-Oakland-Hayward; San Luis Obispo-Paso Robles-Arroyo Grande; Los Angeles-Long Beach-Anaheim; and Oxnard-Thousand Oaks-Ventura.
Infographic: Single and Looking to Buy a Home?
| Single Man | Single Woman | ||
| MSA | Average of EstimatedValue | Average of EstimatedValue | Difference Between Single Men vs Single Women Est. Value |
| San Jose-Sunnyvale-Santa Clara, CA | $ 1,171,251 | $ 1,091,096 | $ 80,155 |
| Santa Cruz-Watsonville, CA | $ 807,516 | $ 748,001 | $ 59,515 |
| San Francisco-Oakland-Hayward, CA | $ 939,353 | $ 886,522 | $ 52,831 |
| Naples-Immokalee-Marco Island, FL | $ 365,947 | $ 316,298 | $ 49,649 |
| San Luis Obispo-Paso Robles-Arroyo Grande, CA | $ 560,166 | $ 515,154 | $ 45,012 |
| Miami-Fort Lauderdale-West Palm Beach, FL | $ 301,029 | $ 257,596 | $ 43,433 |
| Los Angeles-Long Beach-Anaheim, CA | $ 673,783 | $ 633,130 | $ 40,652 |
| Milwaukee-Waukesha-West Allis, WI | $ 179,057 | $ 147,082 | $ 31,975 |
| Urban Honolulu, HI | $ 552,409 | $ 520,585 | $ 31,824 |
| Oxnard-Thousand Oaks-Ventura, CA | $ 564,878 | $ 534,926 | $ 29,952 |
Methodology
For this data dive ATTOM Data Solutions looked at home values across the nation and narrowed down home buyers by single men and single women as stated on the sales deed and tax assessor records. From there ATTOM Data narrowed down the metropolitan areas based on population size of 200,000 or more and having at least 100 or more total properties of SFH and Condos owned by each category.
About ATTOM Data Solutions
ATTOM Data Solutions provides premium property data to power products that improve transparency, innovation, efficiency and disruption in a data-driven economy. ATTOM multi-sources property tax, deed, mortgage, foreclosure, environmental risk, natural hazard, and neighborhood data for more than 155 million U.S. residential and commercial properties covering 99 percent of the nation’s population. A rigorous data management process involving more than 20 steps validates, standardizes and enhances the data collected by ATTOM, assigning each property record with a persistent, unique ID — the ATTOM ID. The 9TB ATTOM Data Warehouse fuels innovation in many industries including mortgage, real estate, insurance, marketing, government and more through flexible data delivery solutions that include bulk file licenses, APIs, market trends, marketing lists, match & append and more.
Media Contact:
Christine Stricker
949.748.8428
christine.stricker@attomdata.com
Data and Report Licensing:
949.502.8313


