
Foreclosure Activity Below Pre-Recession Levels in 60 Percent of U.S. Markets; Foreclosure Starts Up Seven Percent From a Year Ago; Average Foreclosure Timeline Increases 5 Percent From Last Year
IRVINE, Calif. – April 11, 2019 — ATTOM Data Solutions, curator of the nation’s premier property database and first property data provider of Data-as-a-Service (DaaS), today released its Q1 2019 U.S. Foreclosure Market Report, which shows a total of 161,875 U.S. properties with a foreclosure filing during the first quarter of 2019, down 23 percent from the previous quarter and down 15 percent from a year ago to the lowest level since Q1 2008.
The report also shows a total of 58,550 U.S. properties with foreclosure filings in March 2019, up 7 percent from the previous month but down 21 percent from a year ago — the ninth consecutive month with a year-over-year decrease in U.S. foreclosure activity.
“While some markets saw a slight uptick in foreclosure filings, that is above pre-recession levels, the majority of the major markets are well below pre-recession levels,” said Todd Teta, chief product officer at ATTOM Data Solutions. “While we did see a slight increase in U.S. foreclosure starts from last quarter, bank repossessions reached an all-time low in the first quarter of 2019, showing continuing signs of a strong housing market.”
Markets below pre-recession levels include San Jose, Memphis, Dallas-Fort Worth
The 132 out of the 220 markets (60 percent) with a population greater than 200,000 in the first quarter foreclosure activity below pre-recession averages included San Jose (79 percent below); Memphis (77 percent below); Dallas-Fort Worth (77 percent below); Las Vegas (74 percent below); and Phoenix (68 percent below).
Other major markets with first quarter foreclosure activity below pre-recession averages were San Francisco, Riverside-San Bernardino in Southern California, Chicago, Detroit and Seattle.
Markets still above pre-recession levels include Baltimore, Washington D.C., Philadelphia
In 88 out of the 220 markets analyzed (40 percent), first quarter foreclosure activity levels were still above pre-recession averages, including Baltimore (189 percent above); Washington D.C. (26 percent above); Philadelphia (20 percent above); New York (13 percent above); and Hartford (4 percent above).
Other major markets with first quarter foreclosure activity above pre-recession averages included Richmond, Virginia; Virginia Beach, Providence, Rhode Island; and New Orleans.
Foreclosure starts increase 7 percent from last quarter
Lenders started the foreclosure process on 91,397 U.S. properties in Q1 2019, up 7 percent from the previous quarter but down 3 percent from a year ago — the 15th consecutive quarter with a year-over-year decrease in foreclosure starts.
Counter to the national trend, 15 states posted year-over-year increases in foreclosure starts in Q1 2019, including Florida (up 65 percent); Georgia (up 30 percent); Texas (up 27 percent); Louisiana (up 20 percent); Washington (up 12 percent); and Maryland (up 11 percent).
Bank repossessions down in 48 states and DC
Lenders repossessed 35,787 U.S. properties through foreclosure (REO) in Q1 2019, down 21 percent from the previous quarter and down 45 percent from a year ago — the 14th consecutive quarter with a year-over-year decrease in U.S. REOs.
Along with the District of Columbia, 48 states posted year-over-year decreases in REOs in the first quarter, including Arizona (down 77 percent); California (down 41 percent); Florida (down 33 percent); New Jersey (down 59 percent); and Texas (down 43 percent).
Atlantic City, Lakeland, Trenton highest metro foreclosure rates in Q1 2019
Nationwide one in every 836 U.S. housing units had a foreclosure filing in the first quarter of 2019. States with the highest foreclosure rates in the first quarter were New Jersey (one in 333 housing units with a foreclosure filing); Delaware (one in 364); Maryland (one in 412); Florida (one in 487); and Illinois (one in 489).
Among 220 metropolitan statistical areas with a population of at least 200,000, those with the highest foreclosure rates in Q1 2019 were Atlantic City, New Jersey (one in every 177 housing units with a foreclosure filing); Lakeland, Florida (one in 338); Trenton, New Jersey (one in 345); Columbia, South Carolina (one in 372); and Philadelphia, Pennsylvania (one in 373).
Along with Philadelphia, other major metros with a population of at least 1 million and foreclosure rates in the top 25 highest nationwide included Jacksonville, Florida at No. 7, Baltimore at No.9, Cleveland at No. 13, Chicago at No. 14, Tampa at No. 17, Miami at No. 18, and Orlando at No. 21.
Average foreclosure timeline increases 5 percent in first quarter
Properties foreclosed in the first quarter of 2019 had been in the foreclosure process an average of 835 days, up 3 percent from an average 811 days for properties foreclosed in the fourth quarter of 2018 and up 5 percent from an average of 791 days for properties foreclosed in the first quarter of 2018.
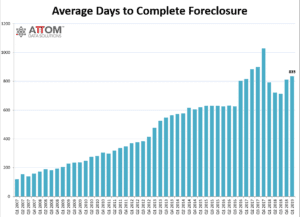
Click here to view the average days to foreclose historical graph
States with the longest average foreclosure timeline for properties foreclosed in Q1 2019 were Indiana (1,806 days), Hawaii (1,565 days), Arizona (1,385 days), New Jersey (1,212 days), and Florida (1,196 days).
States with the shortest average time to foreclose in Q1 2019 were West Virginia (159 days), Virginia (206 days), Minnesota (251 days), Alaska (262 days), and Wyoming (269 days).
March 2019 Foreclosure Activity High-Level Takeaway
- Nationwide in March 2019 one in every 2,312 properties had a foreclosure filing
- States with the highest foreclosure rates in March 2019 were Delaware (one in every 999 housing units with a foreclosure filing); New Jersey (one in every 1,021 housing units); Maryland (one in every 1,077 housing units); Florida (one in every 1,345 housing units); and South Carolina (one in every 1,379 housing units).
- 32,280 U.S. properties started the foreclosure process in March 2019, up 9 percent from the previous month but down 2 percent from a year ago. March 2019 marked the third consecutive month with a month-over-month increase in foreclosure starts.
- Lenders completed the foreclosure process on 12,167 U.S. properties in March 2019, up 7 percent from the previous month but down 53 percent from a year ago.
Report methodology
The ATTOM Data Solutions U.S. Foreclosure Market Report provides a count of the total number of properties with at least one foreclosure filing entered into the ATTOM Data Warehouse during the month and quarter. Some foreclosure filings entered into the database during the quarter may have been recorded in the previous quarter. Data is collected from more than 2,200 counties nationwide, and those counties account for more than 90 percent of the U.S. population. ATTOM’s report incorporates documents filed in all three phases of foreclosure: Default — Notice of Default (NOD) and Lis Pendens (LIS); Auction — Notice of Trustee Sale and Notice of Foreclosure Sale (NTS and NFS); and Real Estate Owned, or REO properties (that have been foreclosed on and repurchased by a bank). For the annual, midyear and quarterly reports, if more than one type of foreclosure document is received for a property during the timeframe, only the most recent filing is counted in the report. The annual, midyear, quarterly and monthly reports all check if the same type of document was filed against a property previously. If so, and if that previous filing occurred within the estimated foreclosure timeframe for the state where the property is located, the report does not count the property in the current year, quarter or month.
About ATTOM Data Solutions
ATTOM Data Solutions provides premium property data to power products that improve transparency, innovation, efficiency and disruption in a data-driven economy. ATTOM multi-sources property tax, deed, mortgage, foreclosure, environmental risk, natural hazard, and neighborhood data for more than 155 million U.S. residential and commercial properties covering 99 percent of the nation’s population. A rigorous data management process involving more than 20 steps validates, standardizes and enhances the data collected by ATTOM, assigning each property record with a persistent, unique ID — the ATTOM ID. The 9TB ATTOM Data Warehouse fuels innovation in many industries including mortgage, real estate, insurance, marketing, government and more through flexible data delivery solutions that include bulk file licenses, APIs, market trends, marketing lists, match & append and introducing the first property data deliver solution, a cloud-based data platform that streamlines data management – Data-as-a-Service (DaaS).
Media Contact:
Christine Stricker
949.748.8428
christine.stricker@attomdata.com
Data and Report Licensing:
949.502.8313
